When will everything be Open Access?

We recently published an article in PeerJ using Unpaywall data to assess the growth and scope of OA. We’re proud of it. By using data from Unpaywall–now the largest open database of OA articles ever–and teaming with a world-class group of coauthors, we had both the data and the expertise to finish with (hopefully) a real useful product.

We won’t summarize the whole paper here (the abstract on PeerJ does a decent job of that), but we did think it would be fun to share one figure that didn’t make it into the paper:

growth-over-time

In the study, we found that OA is increasingly likely for newer articles since around 1990. That’s the solid line part of the graph, and is based on hard data.

But since the curve is so regular, it was tempting to extend it so see what would happen at the current rate of increase. That’s the dotted line in the figure above. Of course it’s a pretty facile projection, in that no effort has been made to model the underlying processes. #limitations #futurework 😀. Moreover, the 2040 number is clearly too conservative since it doesn’t account for discontinuities–like the surge in OA we’ll see in 2020 when new European mandates take effect.

But while the dates can’t be known for certain, what the data makes very clear is that we are headed for an era of universal OA. It’s not a question of if, but when. And that’s great news.

Announcing a better way to measure your value: the Total Impact Score

Measuring the full impact of a scholar’s work is important to us here at Impactstory. No single metric captures all the flavors of your impact–until now.

We’re announcing a thrilling new feature to be rolled out in the next few days: Total Impact Scores.* Now, using one metric to rule them all, you can capture and calculate not only your value as a Scholar, but your worth as a Human Being.

We are increasingly able to track your productivity, effectiveness, and health thanks to the Quantified Self movement. Smart appliances are able to tell us more than ever about your habits in the home.

By forging partnerships with new data providers, we’re able to get a fuller picture of your value on the job and in your private life. To help you make sense of all that data, we’re summarized your impact in the Total Impact Score.

While the exact algorithms we use to calculate your Total Impact Scores are proprietary, we can share with you some of the data streams that are taken into account when compiling your Total Impact Score:

We have also paid close attention to concerns about the over-dependence upon quantitative measures, and will soon roll out qualitative supplements to the Total Impact Score, including full-text reports on your effectiveness as a parent, spouse, co-worker, and friend–as reported by your loved ones and colleagues.

Stay tuned for future announcements about the Total-Impact Score and other innovations in altmetrics!

* Some might recognize the name–Total-Impact is what we called the first iteration of Impactstory. With our single impact metric, the Total Impact Score, you can truly calculate your total impact, beyond the Academy.

Come hangout with us this Thursday!

5QfWVlk.png

Are you curious about altmetrics? Want to learn more about Impactstory, the only non-profit company committed to helping you find all your research impact?

Follow us on Google+ and get your invitation to join Stacy at our official, one-hour Google Hangout this Thursday, March 27th at 2 pm EDT/11 am PDT.

Stay for a few minutes or the entire hour, it’s up to you! We just want to get to know you better and chat about our favorite topic, altmetrics.

Even if you can’t make it, follow Impactstory on Google+ to stay in the loop with our latest news and learn about future Hangouts!


How to be the grad student your advisor brags about

Your advisor is ridiculously busy–so how do you get her to keep track of all the awesome research you are doing? Short answer: do great work that has such high online visibility, she can’t ignore it.

Easy, right?

But if you’re like me, you actually might appreciate a primer on how to maximize and document your research’s impact. Here, I’ve compiled a guide to get you started.

1. Do great work.

To begin with, you need to do work that’s worth bragging about. Self-promotion and great metrics don’t amount to much if your research isn’t sound.

2. Increase your work’s visibility.

Assuming that you’ve got that under control, making your “hidden” work visible is an easy next step. Gather the conference posters, software code, data, and other research products that have been sitting on your hard drive.

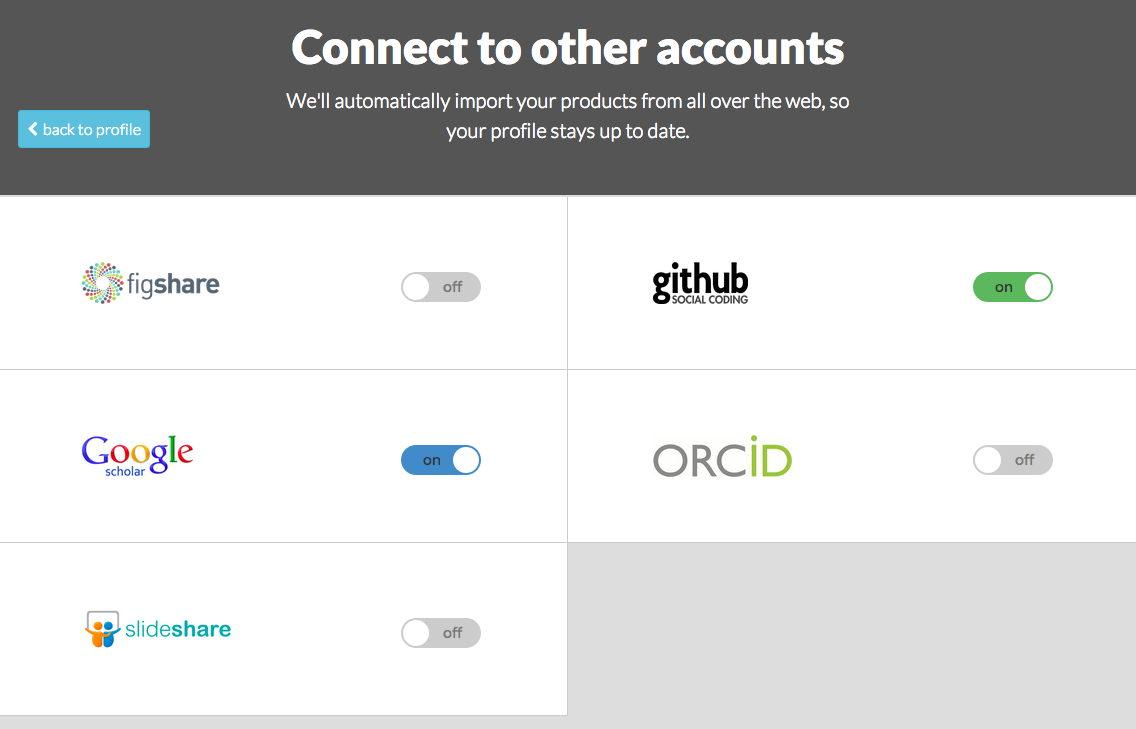
Using Figshare, you can upload datasets and make them findable online. You can do the same for your software using GitHub, and for your slide decks using Slideshare.

Want to make your work popular? Consider licensing it openly. Open licenses like CC-BY allow others to reuse your work more easily, advancing science quickly while still giving you credit. Here are some guides to help you license your data, code, and papers.

Making your work openly available has the benefit of allowing others to reuse and repurpose your findings in new and unexpected ways–adding to the number of citations you could potentially receive. These sites can also report metrics that allow you to see often they are viewed, downloaded, and used in other ways. (More about that later.)

3. Raise your own profile by joining the conversation.

Informal exchanges are the heart of scientific communication, but formal “conversations” like written responses to journal articles are also important. Here are three steps to raising your profile.

  1. Engage others in formal forums. You may already participate in conversations in your field at conferences and in the literature. If you do not, you should. Presenting posters, in particular, can be a helpful way to get feedback on your work while at the same time getting to know others in your field in a professional context.

  2. Engage others more and often. Don’t be a wallflower, online nor off. Though it can be intimidating to chat up senior researchers in your field–or even other grad students, for that matter–it’s a necessary step to building a community of collaborators. An easy way to start is by joining the Web equivalent of a ‘water cooler’ conversation: Twitter. There are lots of great guides to help you get started (PDF).  When you’ve gained some confidence and have longform insights to add, start a blog to share your thoughts. This post offers great tips on academic blogging for beginners, as does this article.

  3. Engage others in the open. Conversations that happen via email only serve those who are on the email chain. Two great places to have conversations that can benefit anyone who chooses to listen–while also getting you some name recognition–are disciplinary listservs and Twitter. Open engagement also lets others to join the debate.

4. Know your impact: track your work’s use online.

Once you’ve made your contributions to your discipline more visible, track the ways that your work is being used and discussed by others online. There are great tools that can help: the Altmetric.com bookmarklet, Academia.edu’s visualization dashboard, Mendeley’s Social Statistics summaries, basic metrics on Figshare, Github, and Slideshare, and Impactstory profiles.

See the buzz around articles with the Altmetric.com bookmarklet

The Altmetric.com bookmarklet can help you understand the reach of a particular article. Where altmetrics aren’t already displayed on a journal’s website, you can use the bookmarklet. Drag and drop the Altmetric bookmarklet (available here) into your browser toolbar, and then click it next time you’re looking at an article on a publisher’s website. You’ll get a summary of any buzz around your article–tweets, blog posts, mentions in the press, even Reddit discussions.

Track international impact with Academia.edu download mapDIIQ7HX.png

One of our favorite altmetrics visualization suites can be found on Academia.edu. In addition to a tidy summary of pageviews and referral sources for your documents hosted on their site, they also offer a great map visualization, which can help you to easily see the international reach of your work. This tool can be especially helpful for those in applied, internationally-focused research–for example, Swedish public health researchers studying the spread of disease in Venezuela–to understand the consumption of articles, white papers, and policy documents hosted on Academia.edu. One important limitation is that it doesn’t cover documents hosted elsewhere on the web.

Understand who’s reading your work with Mendeley Social Statistics

Mendeley’s Social Statistics summaries can also help you understand what type of scholars are reading your research, and where they are located. Are they faculty or graduate students? Do they consider themselves biologists, educators, or social scientists? If you’re writing about quantum mechanics, your advisor will be thrilled to see you have many “Faculty” readers in the field of Physics. Like Academia.edu visualizations, Mendeley’s Social Statistics are only available for content hosted on Mendeley.com.

Go beyond the article: track impact for your data, slides, and code

The services above work well for research articles, but what about your data, slides, and code? Luckily, Figshare, Slideshare, and Github (which we discussed in Step 2) track impact in addition to hosting content.

To track your data’s impact, get to know Figshare’s basic social sharing statistics (Twitter, Google+, and Facebook), which are displayed alongside pageviews and cites.

Oy2LxYQ.jpg     IwENKY2.jpg

To understand how others are using your presentations, use Slideshare’s metrics for slide decks. Impact is broken down into three categories: Views, Actions, and Embeds.

6460FQz.jpg

For code, leverage Github’s social functionalities. Stars indicate if others have bookmarked your projects, and Forks allow you to see if others are reusing your code.

Z6qNgWI.jpg

Put it all together with Impactstory

So, there are many great places to discover your impact. Too many, in fact: it’s tough to visit all these individually, and tough to see and share an overall picture of your impact that way.

An Impactstory profile can help. Impactstory compiles information from across the Web on how often people view, cite, reuse, and share your journal articles, datasets, software code, and other research outputs. Send your advisor a link to your Impactstory profile and include it in your annual review–she’ll be impressed when reminded of all the work you’ve done (that software package she had forgotten about!) and all the attention your work is getting online (who knew your code gets such buzz!).

Congrats! You’re on your way.

You’re an awesome researcher who has lots of online visibility. Citations to your work have increased, now that you have name recognition and your work can more easily be found and reused. You’re tracking your impact regularly, and have a better understanding of your audience to show for it. Most importantly, you’re officially brag-worthy.

Are there tips I didn’t cover here that you’d like to share? Tell us in the comments.

Hello! I’m Stacy.

It is with much excitement that I write this post to introduce myself as Impactstory’s Director of Marketing & Research. Like many of you, I’ve watched with admiration as Heather and Jason built a great product that supports their vision of an Open Internet for scientists, where all scholarship gets the credit it deserves for moving knowledge forward.

I come to Impactstory from a tenure-track position at an academic library, where I spent the last few years supporting scientists’ research data management needs. Some of you might also be familiar with my research into how altmetrics can be adopted in research libraries, to the benefit of faculty and librarians alike.

Last week was my first with Impactstory. We spent many long days coding, writing, debating, and strategizing. I’m still exhausted, but also more inspired and happy than I’ve been in quite some time.

So happy, in fact, I’ll share with you some of our short-term plans:

  • Launching our research into the various impacts of scientific software, for which Impactstory recently won an NSF EAGER grant
  • Expanding our efforts to equip our supporters with the means to promote us–and altmetrics, more generally–within their campus and community
  • Continuing to roll out kick-butt features to Impactstory profiles

Stay tuned for more specific updates soon!

Is your CV as good as you are?

DlcTBLR.png

When’s the last time you updated your CV?

Adding new papers to a CV is a real pain, and it gets is worse as we start publishing more types of products more often — preprints, code, slides, posters, and so on.  A stale CV reveals an incomplete, dated, less-good version of ourselves — at just the moment when we want to put our best foot forward.

Starting today, Impactstory helps you keep your online identity up to date — we’ve begun automatically finding and adding your new research products to your impact profile, so you don’t have to!

You can now connect your other online accounts to Impactstory in a few seconds. We’ll then watch those accounts; when new products appear there, they’ll automatically show up in your Impactstory profile, too.  Right now you can connect your GitHub, figshare, SlideShare, and ORCID accounts, but that’s just the beginning; we’ll be adding lots more in the coming months. We’re especially excited about adding ways to keep your scholarly articles up-to-date, like Google Scholar does.

Do you want to fill the gaps in your CV with an up-to-date, comprehensive picture of your research and its impact? There’s no better way than with an Impactstory profile. Our signup process is smoother than ever, give it a go!

Top 5 altmetrics trends to watch in 2014

Last year was an exciting one for altmetrics. But it’s history. We were recently asked: what’s 2014 going to look like? So, without further ado, here are our top 5 trends to watch:

Openness: This is just part of a larger trend toward open science–something altmetrics is increasingly (and aptly) identified with. In 2013, it became more clear than ever before that we’re winning the fight for universal OA. Since metrics are qualitatively more valuable when we verify, share, remix, and build on them, we see continued progress toward making both  traditional and novel metrics more open. But closedness still offers quick monetization, and so we’ll see continued tension here.

Acquisitions by the old guard: Last year saw the big players start to move in the altmetrics space, with EBSCO getting Plum Analytics, and Elsevier grabbing Mendeley. In 2014 we’ll likely see more high-profile altmetrics acquisitions, as established megacorps attempt to hedge their bets against industry-destabilizing change.  We’re not against this, per se; it’s a sign that altmetrics are quickly coming of age. But we also think it underscores the importance of having a nonprofit, scientist-run altmetrics provider, too.

More complex modelling: Lots of money got invested in altmetrics in 2013. This year it’ll get spent, largely on improving the descriptive power of altmetrics tools. We’ll see more network-awareness (who tweeted or cited your paper? how authoritative are they?), more context mining (is your work cited from methods or discussion sections?), more visualization (show me a picture of all my impacts this month), more digestion (are there three or four dimensions that can represent my “scientific personality?”), more composite indices (maybe high Mendeley plus low Facebook is likely to be cited later, but high on both not so much). The low-hanging altmetrics fruit–thing like simply counting tweets–are increasingly plucked. In 2014 we’ll see the beginning of what comes next.

Growing interest from administrators and funders: We gave multiple invited talks at the NSF, NIH, and White House this year to folks highly placed in the research funding ecosystem. These leaders are keenly aware of the shortcomings of traditional impact assessment, and eager to supplement it with new data. Administrators too want to tell more meaningful, textured stories about faculty impact. So in 2014, we’ll see several grant, hiring, and T&P guidelines suggest applicants include altmetrics when relevant.

Empowered scientists: But this interest from the scholarly communications superstructure is tricky. Historically, metrics of scholarly impact have often been wielded as technologies of control: reductionist, Taylorist management tools. There’s been concern that more metrics will only tighten this control. That’s not misplaced. But nor is it the only story: we believe 2014 will also see the emergence of the opposite trend. As scientists use tools like Impactstory to gather, analyze, and share their own stories, comprehensive metrics become a way for them to articulate more textured, honest narratives of impact in decisive, authoritative terms. Altmetrics will give scientists growing opportunities to show they’re more than their h-indices.

And there you have it, our top five altmetrics trends for 2014. Are we missing any? Let us know in the comments!

What level of Open Access scholar are you?

Today is a feast for Open Access fans at Impactstory!

Your scholarship is more valuable when it’s available to everyone: free to be widely read, discussed, and used.  Realizing this, funders increasingly mandate that articles be made freely available, and OA journals and repositories make it increasingly easy.

And today at Impactstory, we make it visible!

Where your articles have free fulltext available somewhere online, your Impactstory profile now links straight to it (we’ve found many of these automatically, but you can add links manually, too). Now along with seeing the impacts of your work, folks checking out your profile can read the papers themselves.

But openness is more than just a handy bonus: it’s an essential qualification for a modern scholar. That’s why there’s growing interest in finding good ways to report on scholars’ openness–and it’s why we’re proud to be rolling out new Open Access awards. If 10% of your articles are OA (gold or green), you get an Open Access badge at the top of your profile. For the more dedicated, there are Bronze (30% OA) and Silver (50%) award levels. The elite OA vanguard with over 80% OA articles get the coveted Gold-level award. So…which award did you get? How open are you? Check Impactstory to find out!

To celebrate the launch, we’re giving away this awesome “i ♄ OA” tshirt, featuring the now-classic OA icon and our new logo, to one randomly-drawn Bronze or higher level OA scholar on Monday.

Don’t have a Bronze level award yet? Want to see some more of those “unlocked” icons on your profile?  Great! Just start uploading those preprints to get improve your OA level, and get your chance for that t-shirt. 🙂

Finally, we’ve saved the most exciting Impactstory OA news for last: we’ll also be sending one of these new t-shirts to Heather Joseph, Executive Director of SPARC.  Why? Well, partly because she is and has been one of the OA movement’s most passionate, strategic, and effective leaders. But, more to the point, because we’re absolutely thrilled to be welcoming Heather to Impactstory’s Board of Directors.  Heather joins John Wilbanks on our board, filling the vacancy left by Cameron Neylon as his term ends.  Welcome Heather!

Bringing article fulltext to your Impactstory profile

Your work’s impact helps define your identity as a scientist; that’s why we’re so excited about being the world’s most complete impact profile. But of course the content of your work is a key part of your identity, too.

This week, we’re launching a feature that’ll bring that content to your Impactstory profile: if there’s a free fulltext version of one of your articles, we’ll find it and automatically link to it from your profile.

We’ll be automatically checking tons of places to find where an article’s freely available:

  • Is the article in PMC?
  • Is it published in a journal listed in the Directory of Open Access Journals?
  • Is it published in a journal considered “open access” by Mendeley?
  • Does PubMed LinkOut to a free and full-text resource version?
  • If it’s in none of these, is it in our custom-built list of other open sources (including arXiv, figshare, and others)?

Of course, even with all these checks, we’re going to miss some sources–especially self-archiving in institutional repositories. So we’ll be improving our list over time, and you’ll be able to easily add your own linkouts when we miss them.

We’re excited to pull all this together; it’s another big step toward making your Impactstory profile a great place to share your scholarly identity online. Look for the release in a few days!

Welcome to our new hire: Stacy Konkiel!

We’re thrilled to announce that Stacy Konkiel will be joining Impactstory as our Director of Marketing and Research.

Stacy has been in the altmetrics vanguard from the beginning, contributing to PLOS’s early article-level metrics working group, and championing the use of altmetrics in libraries as part of her recent role as Science Data Management Librarian at Indiana University.

Stacy’s communication skills, credibility in the open science and altmetrics communities and–most importantly–her real passion for improving scholarly communication make her the perfect fit at Impactstory. We’re elated to have Stacy as our first hire.

More details to come when Stacy starts in March… we’re just really excited and couldn’t wait to share the news 🙂